

Two teams I know run the same app and reported refund rates of 3.1% and 5.8% for the same month. Neither was lying. They'd defined the metric differently, and nobody had written the definition down.
That's the thing about mobile app refund analytics nobody puts on a feature page. The number is only as good as the attribution rule behind it, and most dashboards don't say which rule they used.
So this post covers what the tools do, and the one methodology question to ask before trusting any of them. For the tracking mechanics alone, how to track App Store refunds goes deeper on the Apple side.
Key Takeaways
Cohort attribution beats period attribution. Count the refund against the month the purchase happened, not the month it landed.
Refund lag runs weeks, sometimes a full billing period. Any dashboard showing this month's rate is showing an incomplete one.
Chargebacks aren't refunds. RevenueCat says plainly it doesn't count one as a refund, so you need a separate feed.
Store consoles are free and weak for trends. Apple gives you reports, Google an API with a daily cap.
The best tools for tracking mobile app refund rates are the ones that publish their denominator.
First, the Definition Problem
There are two ways to run app refund rate tracking and they disagree.
Period method: refunds that arrived in March, divided by transactions billed in March. Easy to build. Wrong, because a March refund often belongs to a January purchase.
Cohort method: of everything billed in January, what share has been refunded since. Harder, because the number never stops moving.
Apphud documents this honestly. Their denominator is transactions billed in the period, the numerator is however many got refunded later, including after it closed. That's the cohort approach, and it matches how refunds behave.
So you need a cutoff. Monthly subscriptions stabilise around 30 to 45 days, annual plans drift for months. Comparing a number that's 10 days old against one that's 90 days old is comparing noise.
The Free Tier: Store Consoles
Start here. It costs nothing, and it's where most teams stop.
App Store Connect. Sales and Trends plus Financial Reports will give you refunds, and the financial report matches your payout. It's period-based, manual, and there's no segmentation by product or channel. Fine for a monthly sanity check. Useless for finding which paywall is bleeding.
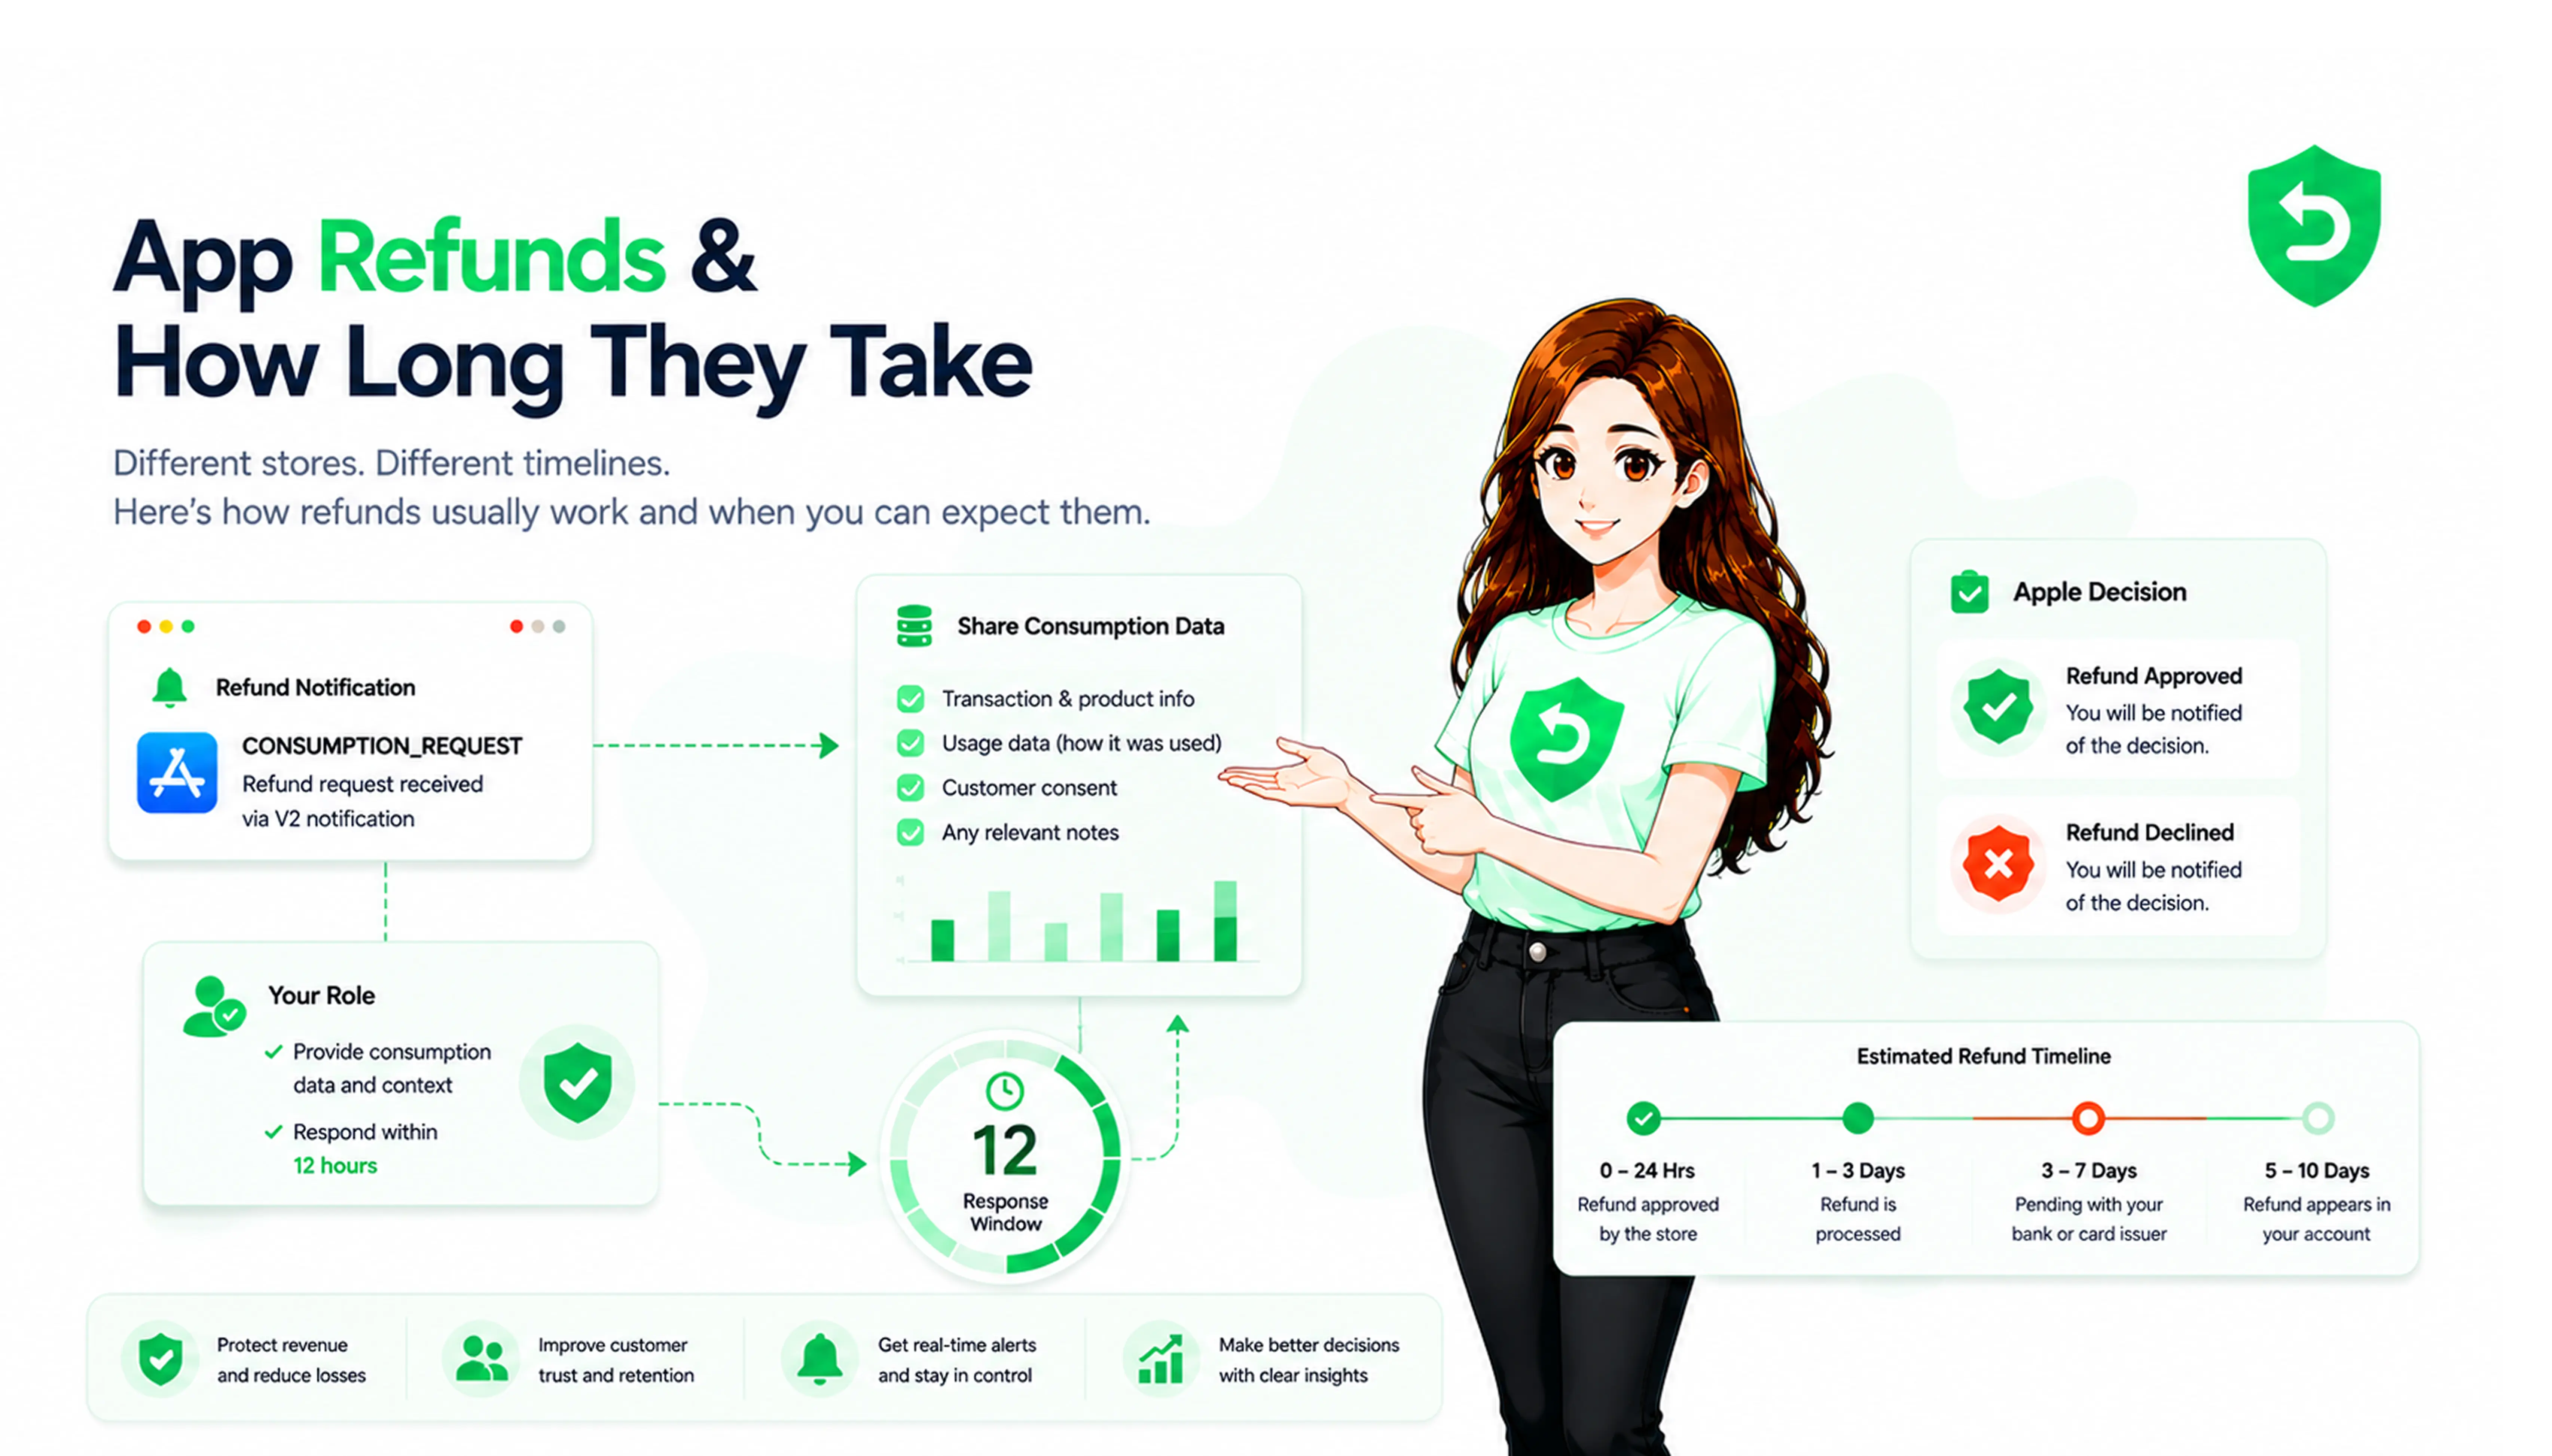
The better free feed isn't in the console at all. Apple's Get Refund History endpoint returns a paginated list of every refunded transaction per customer, which you can pull into your own warehouse. It's rate limited, and Apple recommends notifications over polling, so treat it as reconciliation.
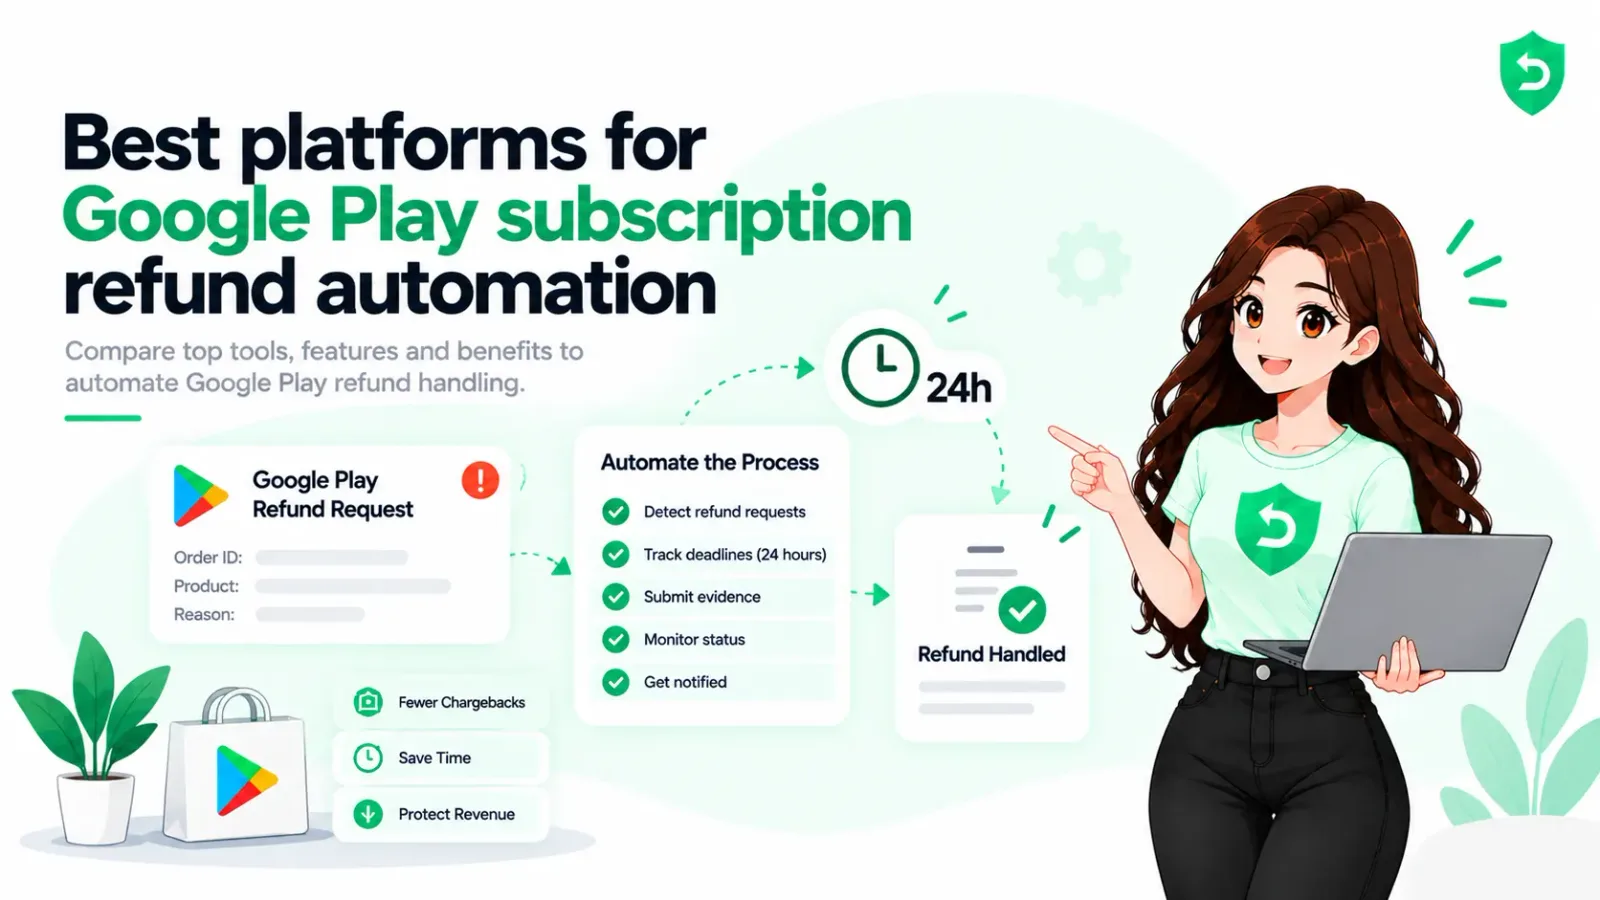
Google Play Console. Financial reports again, plus the Voided Purchases API, listing purchases refunded, charged back or revoked over a time range. Capped at 6,000 calls a day and 30 per 30 seconds, so it's built for scheduled sweeps, not anything live.
Both consoles share a flaw for trend work. They report what settled, not what was requested, so you never see the requests you defended.
RevenueCat
If your subscriptions already run through it, this is the default answer.
Refund rate is one of their benchmark metrics: the share of paid subscriptions refunded during their first billing period, compared against apps in your store and category. That benchmarking is the useful part, since a raw rate with no peer context is hard to act on. Their State of Subscription Apps report covers 75,000-plus apps and puts medians around 3% to 5%.
There's also an App Store Refund Requests chart splitting granted, declined, reversed and awaiting resolution. That's request-level, which most tools skip.
Two caveats. Play refunds granted by Google rather than by you can take up to 24 hours to appear, and refunds issued without the revoke box ticked aren't detected at all. And RevenueCat doesn't count chargebacks as refunds. Purchase status updates, the refund rate doesn't move.
Adapty
Stronger on segmentation than most. Refund tracking breaks down by day, plan, product and acquisition channel, which is the cut that actually finds problems. A rate that looks fine overall and terrible on one channel is a messaging bug, not a product bug.
Their benchmarks come from $1.9 billion in tracked revenue across 11,000-plus apps, and the category spread is wide enough to matter: education and health near 4.7% to 5.1%, travel and utilities closer to 1.5% to 2.1%. Annual plans refund more than weekly. Hard paywalls run roughly 5.8% against 3.4% for freemium.
The catch is the same as elsewhere in their product: the good analytics assume you're on the Adapty SDK.
Apphud
Smaller, cheaper, and unusually clear about methodology, which is why I'd shortlist it for that alone. Their docs spell out the cohort logic instead of hiding it. Real-time dashboards, 18-ish subscription events, less marketing than the alternatives.
If you want a number you can defend in a board meeting, clarity beats a longer feature list.
Dedicated Refund and Chargeback Tracking
Here's the gap. Subscription platforms count refunds that settled. None sit inside the response window, so none can tell you how many requests you defended, or your win rate by refund reason.
That's a different dataset, and it only exists if something is answering the requests. Refund Sensor tracks Apple refund requests and Google Play chargeback reviews as cases, with timelines, outcomes and revenue defended, both stores in one dashboard. It shows the requests that never became refunds.
Worth pairing, not replacing. A subscription platform for cohort analytics, mobile app revenue protection software for request-level trends. Different questions, and neither covers the other.
Tracking Chargebacks Separately
Chargeback trends are not a subset of refund trends, and treating them as one is the most common mistake I see in refund tracking for mobile apps.
On Google Play the signals differ. Real-time developer notifications push a voidedPurchaseNotification when something is voided, and a pendingRefundReviewNotification when a chargeback needs your input. The Voided Purchases API carries a voidedReason field with nine values, including fraud, friendly_fraud and chargeback. It's the closest thing to a free chargeback trend line.
On Apple it's a REFUND notification with a revocation reason, plus REFUND_DECLINED and REFUND_REVERSED for the cases that didn't stick.
For one honest chargeback trend, plot voidedReason equals chargeback over time, split by product. Then plot fraud and friendly_fraud separately, because those accounts repeat and need a different response. We covered which feed does what in Voided Purchases API versus real-time developer notifications.
How to Track Refund Rates and Chargebacks in Mobile Apps
The stack I'd actually build, in order:
Pick an attribution rule and write it down: cohort, with a stated cutoff per plan length.
Wire up the store feeds. App Store Server Notifications V2, and RTDN on Play. Without them you're reading monthly CSVs.
Store every refund event against the original transaction, not today's date.
Add the request-level events, or you'll never see what you prevented.
Split chargebacks out with their own reason codes.
Benchmark against your category, not against a global average.
Step 3 is where homegrown setups quietly break, and step 6 is where dashboards quietly mislead. Neither is hard. Both get skipped.
For the cost side rather than the rate side, how refunds actually cost your app revenue does that math. A rate alone doesn't tell you what to do next.
Sources
Frequently asked questions
RevenueCat if you want category benchmarks and request-level Apple charts. Adapty if you need segmentation by channel and plan. Apphud if you want the clearest published methodology. Add a defense tool if you also want to see the requests that never became refunds.
Refunded transactions divided by paid transactions, attributed to the period the purchase happened in. Then decide how long you let a cohort mature before calling it final. Monthly plans, 30 to 45 days. Annual, longer.
Between 2% and 5% of paid transactions for subscription apps. Education, health and fitness run higher, travel and utilities lower. Past 10%, stop looking at marketing and go read your paywall.
Not properly. Apple's financial reports show refunds that settled. Google's Voided Purchases API shows voided purchases with a reason code, which is the nearest thing, but it's capped at 6,000 calls a day and needs a scheduled sweep.
Almost always attribution lag. Revenue reports are period-based, refund rates should be cohort-based, and the two only converge once every refund has landed. Also check whether chargebacks are included, since some tools exclude them.
Apple doesn't publish a threshold, and I'd be suspicious of anyone quoting one confidently. What is documented is that persistently high refund and dispute rates can affect account standing on Google Play. That's a stronger reason to track the trend than the rate.