
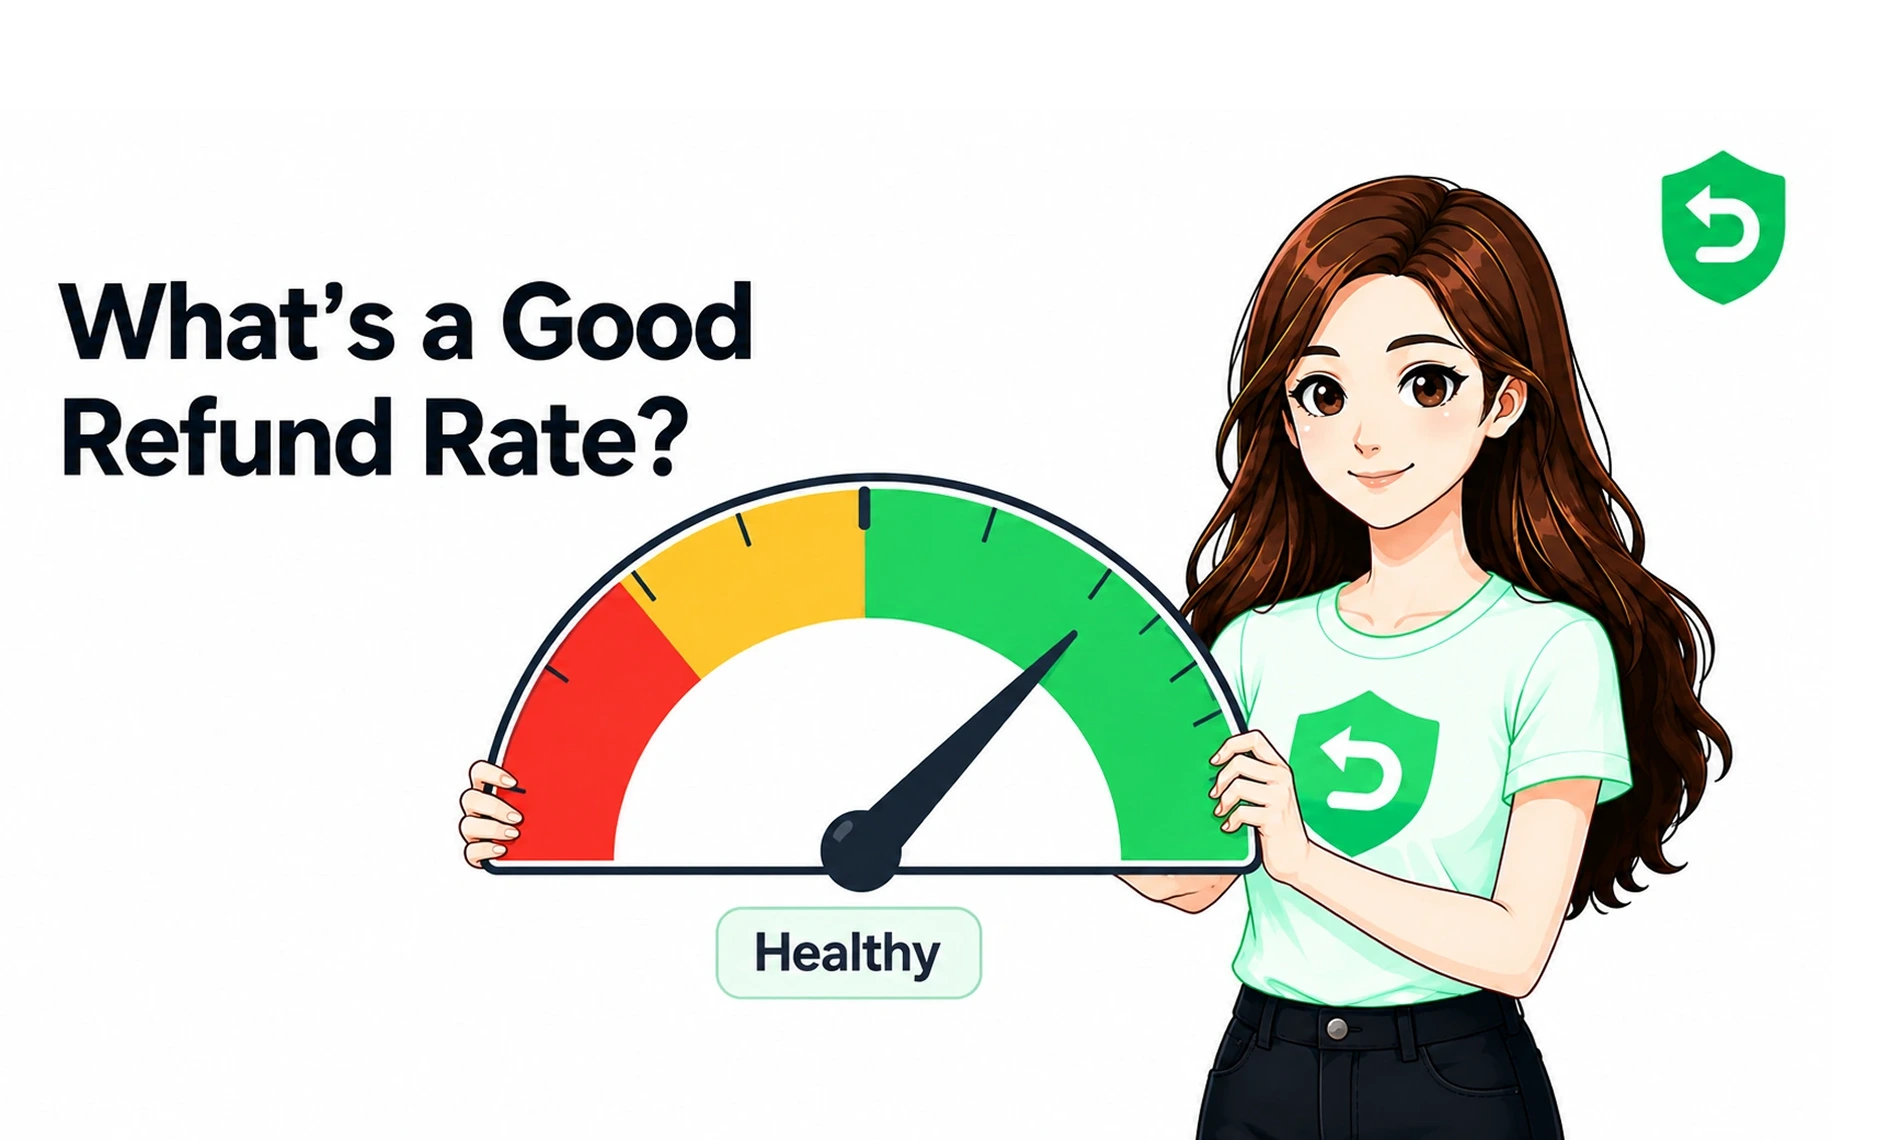
Quick answer: There's no single "good" refund rate, it depends heavily on your app category, price point, and how you use trials. As a rough orientation, many subscription apps sit in the low single digits as a percentage of revenue, but the healthy range for a utility app looks nothing like the healthy range for a game or a high-priced annual subscription. The right question isn't "is my rate good in the abstract" but "is my rate good for my category, and how much of it is contestable leakage versus genuine dissatisfaction."
Why "good" depends on your category
Ask "what's a good refund rate" and you'll get a single number from most sources, usually something like "under 5%." That number is close to meaningless on its own, because it ignores the biggest variable: what kind of app you run.
A one-off utility that people buy to do a single task has a completely different refund profile than a habit-forming fitness app on an annual plan. A cheap monthly subscription behaves differently from a premium annual one. A game with consumable purchases is its own world. Comparing your rate to a global average tells you almost nothing; comparing it to apps like yours tells you whether you actually have a problem.
What drives the differences
The category gaps aren't random. A few factors explain most of the spread:
One-off value vs. ongoing value. Apps people buy to accomplish a single task see more use-and-refund behavior, pushing rates up. Apps with ongoing value have less incentive to refund.
Trial design. Aggressive or unclear trials convert more users but also invite more trial abuse and "I didn't mean to subscribe" refunds. Clean trials trade a little conversion for a lot less refund friction.
Price point. Higher-priced annual subscriptions draw more scrutiny and more refund requests per purchase, even when satisfaction is high.
Purchase clarity. The clearer the paywall about what's being bought and when billing starts, the fewer "accidental" refunds.
Notice that most of these are things you influence through product and UX, which is why refund rate is partly a design metric, not just a support metric.
How to read your own refund rate
Put your number in context with three questions:
How does it compare within my category? Above your category range is a signal worth investigating; within or below it, you're likely fine on the headline number.
Is it trending, and which way? A stable rate in a normal range is healthy. A climbing rate is the thing to catch early, whatever the absolute number.
What's it made of? Two apps with an identical 4% rate can be in completely different situations, one mostly genuine dissatisfaction, one mostly contestable abuse. The composition matters more than the headline.
That third question is the one most developers never ask, and it's the most important.
Rate isn't the whole story: contestable vs genuine
A refund rate is a blend of two very different things:
Genuine dissatisfaction, users the product let down. The fix is product work, and often the refund should be granted.
Contestable leakage, trial abuse, use-and-refund, false "accidental" claims. These you can respond to, and losing them to a missed window is pure waste. (See refund abuse patterns.)
Two apps at the same rate need opposite strategies depending on the mix. If your rate is high but mostly genuine, chase the product friction. If it's high and heavily contestable, the fastest recovery is responding to every eligible request in time, which is where automation moves the number. This is why a headline refund rate, on its own, can't tell you what to do; you have to see it broken down by reason.
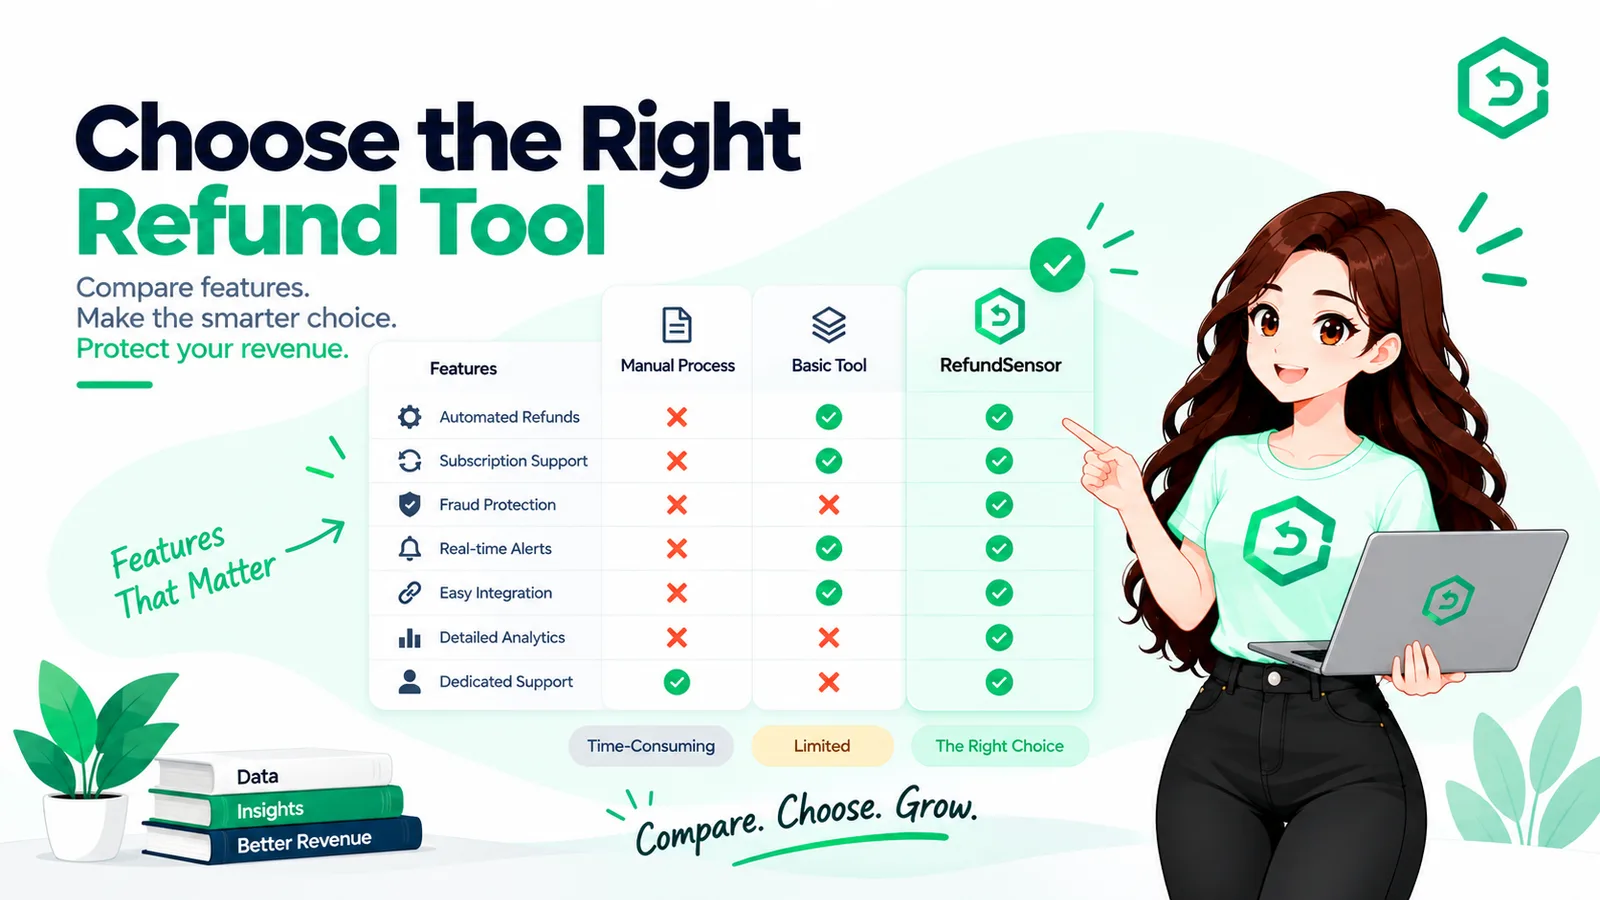
RefundSensor shows exactly that split, your refund rate broken down by app and by reason, so you can tell contestable leakage from genuine dissatisfaction, and it responds to the contestable Apple and Google Play requests inside the window automatically. You find out not just whether your rate is good, but which half of it you can actually do something about.
Further reading
https://developer.apple.com/app-store/small-business-program/
https://support.google.com/googleplay/android-developer/answer/112622
https://support.google.com/googleplay/android-developer/answer/2741495
https://support.google.com/googleplay/android-developer/answer/17068375
https://www.revenuecat.com/blog/growth/does-apple-keep-its-commission
https://www.chargebackgurus.com/blog/chargeback-fees-the-true-cost-of-your-chargebacks
Find out which half of your refund rate you can actually recover. RefundSensor breaks your refunds down by app and reason, and responds to every eligible Apple and Google Play request inside the window. Start free
Benchmarks are drawn from the RefundSensor Refund Index (aggregated, anonymized; a directional industry benchmark, not a full census).
Frequently asked questions
It depends on category, price, and trial design. Many subscription apps sit in the low single digits of revenue, but the healthy range differs sharply by category, compare within your category using the Refund Index rather than to a global average.
There isn't one meaningful average across all apps because categories vary so much. [FILL with the actual Index finding, e.g. category norms ranged from X% to Y% this edition.]
Not necessarily, it depends what it's made of. A rate driven by genuine dissatisfaction signals product problems; a rate driven by contestable abuse signals recoverable leakage. The composition matters more than the number.
Two levers: reduce the friction that causes genuine refunds (clear trials and paywalls, delivering on the purchase), and stop losing contestable refunds to a missed response window by responding to every eligible request in time.
The RefundSensor Refund Index, built from aggregated, anonymized refund requests across Apple and Google Play. It's updated each edition.