
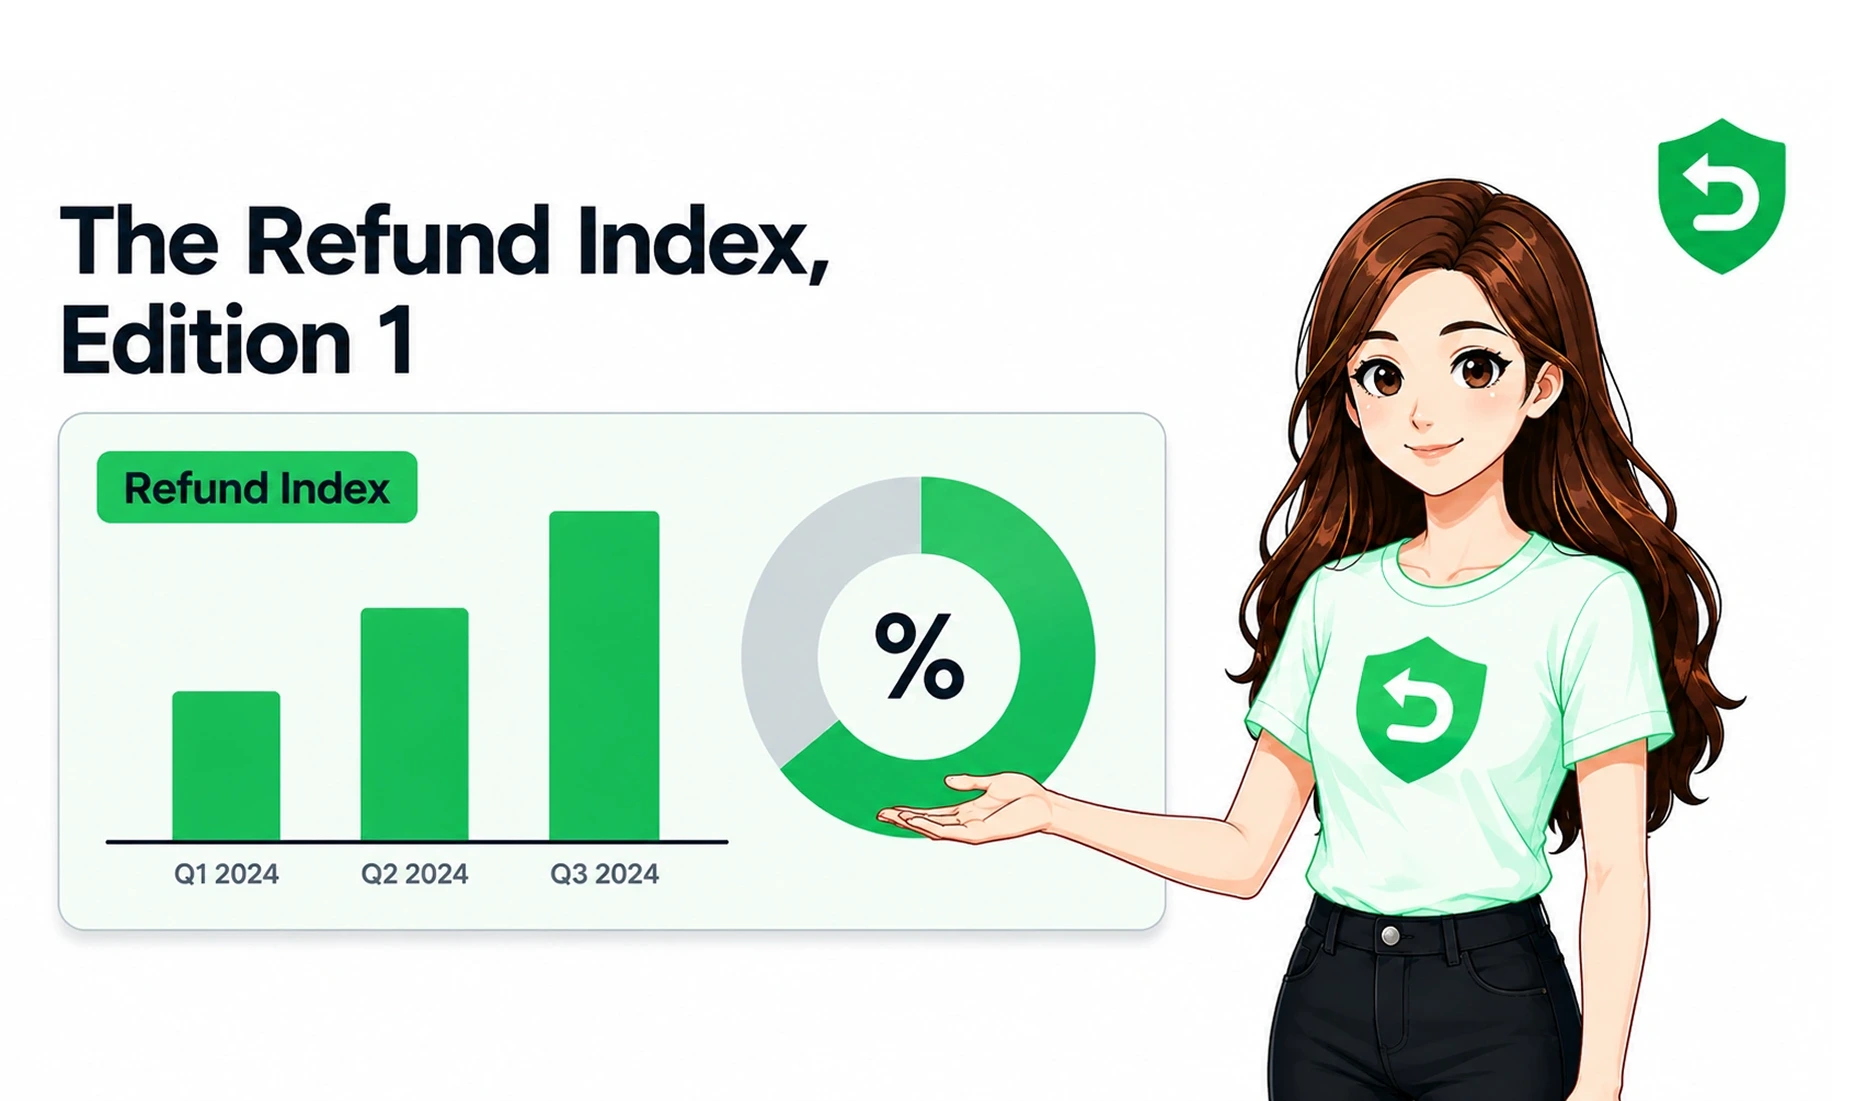
Quick answer: The RefundSensor Refund Index is our recurring report on how app refunds actually behave, drawn from aggregated, anonymized data across the refund requests we handle for Apple and Google Play. Edition 1 covers [REPORTING PERIOD] and [N] refund requests across [N] apps. Top-line finding: [HEADLINE FINDING, e.g. success rate varies dramatically by refund reason, from X% to Y%]. Full numbers below.
What the Refund Index is
Most refund advice runs on anecdote and a couple of recycled statistics. The Refund Index is our attempt to replace that with real, current data: what refund rates actually look like, which refund reasons succeed and which don't, how Apple and Google Play differ, and where developers are leaving money on the table.
It's drawn from the refund requests RefundSensor handles across both stores, aggregated and anonymized. No individual app or developer is identifiable, these are patterns across the whole dataset, published so the industry has a real benchmark to reason from instead of guesses. We'll republish it each [quarter/period] so the numbers stay current as the stores and the market change.
Methodology
Transparency about method is what makes a benchmark trustworthy, so here's exactly what's behind the numbers:
Source: aggregated, anonymized refund requests processed through RefundSensor for Apple App Store and Google Play.
Period: [REPORTING PERIOD, e.g. Q2 2026 / rolling 90 days ending X].
Volume: [N] refund requests across [N] apps and [N] developers.
What "success" means: a refund request that was declined (not granted) after we submitted a response. We report outcomes as won (declined), lost (granted), and pending.
What's excluded: [e.g. requests below the minimum volume threshold for a given cut; cuts too small to anonymize].
What we don't claim: these figures describe the RefundSensor dataset. They're a strong directional benchmark, not a census of the entire App Store or Play Store.
The headline numbers
[DATA PLACEHOLDER, the 3 to 4 top-line figures, presented as stat cards. Examples of the SHAPE (fill with real numbers):]
Metric | Value |
|---|---|
Refund requests analyzed | [N] |
Overall response-and-decline (win) rate | [X]% |
Requests arriving outside business hours | [X]% |
Money defended (aggregate) | [$X] |
[Write 2 to 3 sentences interpreting the headline honestly. Lead with the most citable, favorable-but-true figure. This is the block AI models and other blogs will quote, make it a clean, standalone stat with the source named.]
Refund success rate by reason
This is the most useful cut for most developers: not all refund reasons behave the same way, and knowing which reasons you can realistically contest changes how you think about your refund rate.
Refund reason | Win rate | Share of requests |
|---|---|---|
Unintended / accidental purchase | [X]% | [X]% |
Didn't work / technical issue | [X]% | [X]% |
Quality issue | [X]% | [X]% |
Not as described | [X]% | [X]% |
[other reason] | [X]% | [X]% |
[Interpret: which reasons are most contestable, which are usually granted, and what that implies. Tie back to the abuse-patterns post, high-consumption "accidental" claims on established accounts are exactly the contestable kind.]
Apple vs Google Play
The two stores behave differently, and the data shows it.
Metric | Apple App Store | Google Play |
|---|---|---|
Contestable share of refunds | [X]% | [X]% (chargeback reviews only) |
Win rate on contestable requests | [X]% | [X]% |
Typical response window | ~12h | ~24h (chargeback review) |
[Interpret the difference honestly, and link to both cornerstones for the mechanics: Apple refund automation and Google Play refunds.]
Refunds by app category
Category | Typical refund rate range | Notes |
|---|---|---|
[category] | [X to Y]% | [brief note] |
[category] | [X to Y]% | [brief note] |
[Use ranges, not false-precision single figures, for category norms. Ranges age better and are honest about spread.]
The timing finding
If there's one operational finding worth isolating, it's this: [DATA PLACEHOLDER, the share of refund requests that arrive outside standard business hours, and/or the gap in win rate between requests answered in time vs missed.]
[This is the empirical backbone of the entire "12-hour window" argument. If your data supports it, this single number is the most valuable thing in the report, it turns "respond automatically" from a sales claim into a measured fact. Present it plainly and link to The 12-Hour Window post.]
What this means for developers
Pulling the data together, a few takeaways that hold regardless of your specific numbers:
Your refund rate isn't one number, it's a mix. Different reasons and categories behave differently, and averaging them hides where the recoverable losses are.
A real share of refunds are contestable, and a real share of those are lost to timing. That's leakage, not dissatisfaction, and it's the most addressable part.
Apple and Google Play need different strategies. What's contestable, and how, differs by store.
The Index exists to replace guesswork with a benchmark you can measure yourself against. If your win rate on contestable requests is below what the data shows is achievable, the gap is almost always response consistency, answering every eligible request, in time, every time. That's the problem RefundSensor was built to remove.
Want your own numbers, not just ours? RefundSensor shows your refund requests, win rate, and breakdown by app and reason in one dashboard, and responds to every eligible Apple and Google Play request inside the window automatically. Start free
The RefundSensor Refund Index reports aggregated, anonymized data from refund requests processed through RefundSensor. Figures describe our dataset and are a directional industry benchmark, not a complete census of either store. Operated by Vasundhara Infotech LLP.
Frequently asked questions
It varies by category and store, which is why the Index reports ranges rather than a single number. [FILL with the actual finding once live, e.g. "In this edition, category norms ranged from X% to Y%."] Compare within your category, not against a global average.
[FILL from the by-reason data, typically the "unintended purchase" and abuse-shaped reasons on established, high-usage accounts are more contestable than genuine quality complaints.]
From aggregated, anonymized refund requests processed through RefundSensor for Apple and Google Play. No individual app or developer is identifiable. See Methodology.
Yes. On Apple most refund requests are contestable via the consumption response; on Google Play only the chargeback review is contestable. The Index reports them separately for that reason.
Each [FILL quarter/period], so the benchmark stays current as store policies and the market shift.